
Showing posts with label Tutorial ArcGis. Show all posts
Showing posts with label Tutorial ArcGis. Show all posts
Tutorial ArcGis : Query data
TUTORIAL ARC GIS GETTING TO KNOW ARCGIS DESKTOP
Chapter 7: Query data in ArcGIS
 |
| Tutorial ArcGIS: Query data |
Tooltips and hyperlinks
- Tooltips/Links: Documents-URL-Macro

Tooltips
The content of a field can be dynamically displayed in ArcMap, in the form of a tooltip by positioning the mouse cursor over an entity.
The management of the tooltips display is in the Display tab of the dialog box properties of the layer by activating Property Show Tooltips (as the primary display field).
The field used for the value of the tooltip is said in the Fields tab in the same window.
For coverages and shapefiles, the tooltips display can be done if an index Space has been previously created.
For coverages and shapefiles, the tooltips display can be done if an index Space has been previously created.
A spatial index is a similar attribute index. An index is a way to access data faster.
The construction of a spatial index optimizes the display time and processing of spatial queries.
You can build a spatial index from ArcInfo Workstation (for covers) from ArcView (for file types) or still using the ArcCatalog application.
Dynamic links
Each entity of a layer can be associated with one or more hyperlinks.
A hyperlink opens a file or URL (web address) by clicking on an entity.
For example, if you associate a photograph with each building in your bed, you can view this image by clicking the building using the dynamic link tool.
Define a hyperlink in the attribute table
A dynamic link can be defined for all the features in a layer. In this case, you must store in a field of the attribute table of the layer, document name, or associated URLs of each entity.
For example, for every building, you enter in a table field name (with path) of the associated image (eg c: \ gis \ data \ pictures \ batAB325.tif).
To know what ArcMap is the field containing the document name or URL, you must specify in the Display tab of the dialog box of the properties of the layer, the field name containing the hyperlink.
Set links manually
A dynamic link can be manually assigned to certain entities.
For this, you must use Identify the tool to display the attributes of the entity to which you want to associate the link.
Once the Identification card displayed, select the identifier of the entity and then run the Add Hyperlink from the context menu.
You can then choose the document or the URL you want to associate your entity.
The manually defined dynamic link is stored in the map document.
They are therefore not usable outside of the document unlike stored in dynamic link Tables.


They are therefore not usable outside of the document unlike stored in dynamic link Tables.
Identify and search for entities

Identify

Search

Identify
The Identify tool displays the attributes of an entity.
This tool uses a search tolerance around the point you clicked.
To change this tolerance, click Selection> Options.
The function of tolerance is available in the selection of the tolerance area.
The function of tolerance is available in the selection of the tolerance area.
Search
On the other hand, if you know what (s) attribute (s) you are looking for but you do not know what entities with these attributes, the search function can help you locate these entities.
This feature is very useful for determining which entities having a particular attribute.
When Clicking on the Search button, a dialog box appears.
You can specify what the attribute you are looking to identify and the layer or layers in which the entities are located with these attributes.
This dialog box lets you search the attributes in a field-specific table in all fields of the table or only in the main field of layer (that is to say the default field used in the labeling of entities or when creating the tooltips).
Once you have completed your search, click the right mouse button on any result.
Several choices are then available: you can choose to flash the entity of zoom directly thereon, to select or define a bookmark.
YOU MIGHT ALSO LIKE: PRACTICAL WORK ARC VIEW SOFTWARE
 The measurement tool
The measurement tool used to measure the linear distance between the entities and reports in this distance the status bar of the ArcMap document.
YOU MIGHT ALSO LIKE: PRACTICAL WORK ARC VIEW SOFTWARE
Measuring tools
Measure distances

The measurement tool used to measure the linear distance between the entities and reports in this distance the status bar of the ArcMap document.
When you click in different places in the display area, you may find a line that appears.
This segment is used to connect two selected points and has a length that appears in the status bar.
The status bar displays two values: the first value represents the length of the last route segment while the second shows the total length of all segments.
The end of the Measurement is done by double-clicking; the line disappears and the last measurement is still displayed in the status bar.
In ArcMap, all expressed measurements use a Cartesian coordinate system. You do not So you cannot avoid errors due to various factors (human error, errors due to projection systems ...) when you use the measurement tool.
The Tools and options of selection
Selecting entities

Once selected, it is possible to manipulate entities so independent of the other features in a layer.
Selecting entities sets what are the entities that you want to work?
For example, you might wish to delete, move or copy these entities.
To do this, simply select them.
Set Selectable Layers
It may be necessary to limit the selectable layers. For example, if you have a layer representing cities, most of these towns are located along the river, it can need not to make the layer containing the selectable rivers.
Set Selectable Layers
It may be necessary to limit the selectable layers. For example, if you have a layer representing cities, most of these towns are located along the river, it can need not to make the layer containing the selectable rivers.
The work you will be all faclilité more.
Selection methods
You can select entities by pointing with the mouse, by performing attribute query or by using spatial relationships.
Selection methods
You can select entities by pointing with the mouse, by performing attribute query or by using spatial relationships.
The selected entities are highlighted and the result of The selection appears in the bottom left corner of the document window ArcMap.
Create a new layer
When entities are selected, it is possible to create a new layer or to export selection in a new feature class. Depending on the format of the data source, it is possible to export this selection in a form or in an existing geodatabase file.
Create a new layer
When entities are selected, it is possible to create a new layer or to export selection in a new feature class. Depending on the format of the data source, it is possible to export this selection in a form or in an existing geodatabase file.
Various selection tools

Choose a selection command:
Several commands are used to select entities with ArcMap. For example, you can select interactively the entities clicking on the screen, change an existing selection, perform attribute query or use geographical criteria.Interactive Tools
The selection tool lets you select entities by pointing or drawing a frame in the area display. Selection tools are accessible from the Select menu.
The command interactive selection method lets you create a new selection, add to the current selection, remove the current selection or select the current selection.
The command opens the Options dialog box to refine the methods of interactive features.
You can select entities that are partially or completely contained in a frame or a graphic element, select features that are completely contained in a frame or graphics element or to select the entities completely containing a part or item graph.
You can select entities that are partially or completely contained in a frame or a graphic element, select features that are completely contained in a frame or graphics element or to select the entities completely containing a part or item graph.
Attribute queries
The Select by Attributes will create an attribute query that is to say a request based on attributes contained in the attribute table of the layer.
Because of the link between entities and their attributes, the selection in the table used to select entities.
Spatial queries
The Select by entity selects entities based on the contained entities in another layer.
This order is considered to be a spatial query tool.
Other controls accessed through this menu to control the layers to consider in the selection, zooming on selected features ...
 Interactive selection tool:
The selection tool located in the outils bar allows you to select one or more entities.
Other controls accessed through this menu to control the layers to consider in the selection, zooming on selected features ...
Interactive selection tool:

The selection tool located in the outils bar allows you to select one or more entities.
If the user clicks on a point, one entity is selected.
However, if the user draws a rectangle, all entities intersected by the rectangle are selected (with the selection options by default).SHIFT (capital) keeps the previous selection and add the new selection (with the default selection method).
The selection tool applies only selectable layers.
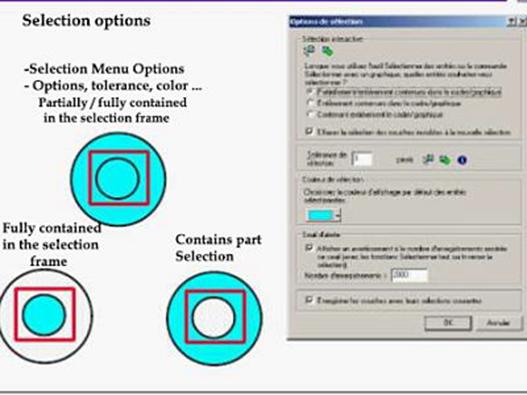
When you select entities or interactively using a graphic element, more behaviors can be defined for research entities. You define these behaviors using the Options command from the Select menu.
Partially / fully contained in the selection frame:
This option allows you to select entities that are contained in or affected by the rectangle is drawn by the user or by the graphic element.
Selection options

Partially / fully contained in the selection frame:
This option allows you to select entities that are contained in or affected by the rectangle is drawn by the user or by the graphic element.
Fully contained in the selection frame:
This option allows you to select only the features contained in the rectangle drawn by the user or by the graphic element.
This option allows you to select only the features contained in the rectangle drawn by the user or by the graphic element.
Fully containing the bounding box:
This option allows you to select only the entity that completely contains the rectangle is drawn by the user or the graphic element.
This option allows you to select only the entity that completely contains the rectangle is drawn by the user or the graphic element.

Selection Tolerance:
When you select an entity by clicking a point on the map, ArcMap uses a distance Search around this point to find entities intersected by it.
When you select an entity by clicking a point on the map, ArcMap uses a distance Search around this point to find entities intersected by it.
This tolerance is expressed in screen pixels. It is valid for all selectable layers.

ArcMap offers four methods for interactive selection tools. These methods determine what so the new selection must be combined with the previous one.
Interactive selection methods

You can, for example, First, select the parcels that are within the scope of protection described by an element graph (first geographical query) can restrict this selection to lands, in addition, to located in the rectangle you just drew (second geographic query).
For this, you must specify that the new selection must be made among the entities of the previous selection.
You specify the method of selection with the command Select -> Interactive Selection Method.
Create a new playlist
With this method, the new selection replaces (erases) the previous selection. This method is the default method.Add to the current selection
With this method, the new selection is added to (complete) the previous selection.
The selection Previous thus preserved and enriched the entities of the new selection.

These queries can be saved (Save button) and reloaded (Load button) in the query builder.
Clear the current selection
With this method, entities that meet the new selection will be deselected.Select from the current selection
With this method, research entities for the new selection are made only among entities of the previous selection. The goal is to refine the previous selection.Attribute queries

Attribute queries
The command Select -> Select By Attributes uses the SQL (Structured Query Save) to perform queries based on the values of the fields in the attribute table layers.These queries can be saved (Save button) and reloaded (Load button) in the query builder.
Query syntax
The drafting of the application can be done either by typing the words on the keyboard or by selecting fields, operators, and values in the respective lists and buttons.
The Verify button to validate the expression syntax before executing the query. You'll notice that the syntax field names vary the format of the data layer.
A few Examples illustrate these differences:
-Géodatabase: [area]> 5000/[name] = 'meudon'
-Shapefiles: "area" > 5000/ "name" = 'meudon'
-Blankets : "area" > 5000/ "name" = 'meudon'
-CAD files / DAO: Color = 5 / Layer = 'parcelle'
-Géodatabase: [area]> 5000/[name] = 'meudon'
-Shapefiles: "area" > 5000/ "name" = 'meudon'
-Blankets : "area" > 5000/ "name" = 'meudon'
-CAD files / DAO: Color = 5 / Layer = 'parcelle'
Selection methods
Attribute selection can be performed according to 4 methods. These methods are the same as for the tool Interactive selection.Spatial queries
- Use the features in a layer to select features in another layer.
- Dialog Select by the entity

Spatial queries:
The command Select -> Select per entity allows for queries based on the position entities in relation to features in another layer. The first example of this command is to select shopping centers in a given department.
A second illustration of the command would select malls located within 5 km of a highway.
It is possible to make selections in several layers at once.
ArcMap can use all entities of the selector layer or only the entities that are selected.

Geographical criteria:
Several space research criteria are proposed, most can be completed by perimeter research.
= Intersect intersect entities selector layer
Are in the scope of = are within the scope of the entities in the selection layer
Are completely content = are completely contained in the entities of the selection layer
= Completely contain the entities in the selection layer
= In the center have had their center in entities of the selection layer
Sharing a point, a line, or a limit = sharing a point, a line, or a limit with entities layer selection
= Are identical are geometrically identical entities to the selector layer
Are intersected by the contour = are traversed by the boundaries of the entities of the selector layer
Different types of selection:
It is possible in ArcMap to select from the following four selection methods:- Select features in a layer
- Add to selected features in a layer
- Delete selected features in a layer
- Select from the selected features in a layer
Geographical criteria

Geographical criteria:
Several space research criteria are proposed, most can be completed by perimeter research.
= Intersect intersect entities selector layer
Are in the scope of = are within the scope of the entities in the selection layer
Are completely content = are completely contained in the entities of the selection layer
= Completely contain the entities in the selection layer
= In the center have had their center in entities of the selection layer
Sharing a point, a line, or a limit = sharing a point, a line, or a limit with entities layer selection
= Are identical are geometrically identical entities to the selector layer
Are intersected by the contour = are traversed by the boundaries of the entities of the selector layer
Tutorial ArcGis:Manipulate data georeferenced part2
TUTORIAL ARC GIS GETTING TO KNOW ARCGIS DESKTOP
Chapter 6: Manipulate data georeferenced continue
 |
| Tutorial ArcGis: Manipulate data georeferenced part2 |
ArcMap and projections

If one or more layers have no world file, a message appears when adding these layers in the map document indicating that the information is missing.
The projection on the fly
When the user works in a map document, the application selected from the various map projections available to it a coordinate system and any layers affect managed in the document so as to allow the superimposition of the different entities: This is the projection on the fly.
The initial projection data is not changed but is used to allow the superposition of entities.
If one or more layers have no projection file or georeferencing, ArcMap will display a message telling you that it is not able to project broadcast entities of these layers and it is possible that the individual layers do not appear superposed in the display geographical area.
The default projection system
By default, ArcMap affects the geographical display area the projection of the first layer added.
When other layers are added to the map document, they will be automatically projected into the projection default map document.
By default, ArcMap affects the geographical display area the projection of the first layer added.
When other layers are added to the map document, they will be automatically projected into the projection default map document.
However, the user can define itself its own coordinate system of the hundreds of Predefined files it has. To do this, the Coordinate System tab of the dialog box Block properties used to select the coordinate system that will be used to display area Geographic.
Projections on the fly

The default projection system
By default, ArcMap affects the geographical display area the projection of the first layer added.
When other layers are added to the map document, they will be automatically projected into the projection default map document.
However, the user can define itself its own coordinate system of the hundreds of Predefined files it has. To do this, the Coordinate System tab of the dialog box Block properties used to select the coordinate system that will be used to display area Geographic.
By default, ArcMap affects the geographical display area the projection of the first layer added.
When other layers are added to the map document, they will be automatically projected into the projection default map document.
However, the user can define itself its own coordinate system of the hundreds of Predefined files it has. To do this, the Coordinate System tab of the dialog box Block properties used to select the coordinate system that will be used to display area Geographic.
Define work units

Without this step, ArcMap is not able to display the data representation ladder or express good distances between entities.
Define work units
This information must be indicated on the General tab of the Properties dialog box for each block of data present in the map document. First, it is necessary to fill in the map units.
This information must be indicated on the General tab of the Properties dialog box for each block of data present in the map document. First, it is necessary to fill in the map units.
These units are directly related to the coordinate system assigned to the data source.
In case of doubt on the unit used for storage of data, check the data dictionary or contact the Data Provider When the map units are filled, it remains to indicate what units you in ArcMap want to work in your document. To do this, simply choose from the dropdown menu Show these units.
ArcMap will use these units during the display of the measures taken in the document.
Tutorial ArcGis:Manipulate data georeferenced part1
TUTORIAL ARC GIS GETTING TO KNOW ARCGIS DESKTOP
Chapter 6: Manipulate data georeferenced
 |
| Tutorial ArcGIS: Manipulate data georeferenced part1 |
It is, therefore, necessary to reference the data in precisely locating the surface of the earth (that is called georeferencing). If the entities are not exactly positioned or if forms used to represent objects are not correct, use a map or in GIS analysis of uniting spatial relationships do not give appropriate results.
It is therefore important to understand and determine their coordinates.
What georeferencing?
Georeferencing is the process of establishing a relationship between the data displayed in your Geographic Information System and their position in the real world.
Georeferencing is the process of establishing a relationship between the data displayed in your Geographic Information System and their position in the real world.
The earth is round, and the cards are flat, the conversion of geographical positions of a surface curve on a flat surface requires the use of a mathematical formula called projection Mapping.
To use the data in your GIS, it is necessary to reference their position on the surface of Earth.
Using a coordinate system, georeferencing transform spatial data geospatial data.
Georeferencing includes three different types of operations:
the transformation of spatial data Geospatial by the declaration of the coordinate system, transforming a system geographical coordinates to another, converting the spatial data processing Algebraic (translation, rotation ...).
what is a card?
- A map is a flat representation, simplified surface land.


- Any object (or phenomenon) is locatable in space capable of being represented geographically on a map.
A map is a planar geometric representation, simplified and conventional of all or a part of the Earth's surface, in a similar report, agreed: the scale.
Any object or phenomenon localized on the surface of the globe is likely to be mapped.
Historic
The first cards were designed to be able to identify and heading into space.
They represented fixed geographic objects to locate the great elements of space and occupation (relief, during the water, roads ...).
The evolution of the spatial representation of needs and the changing character of the parameters of human geography has resulted in a change of objective cartographic document.The first cards were designed to be able to identify and heading into space.
They represented fixed geographic objects to locate the great elements of space and occupation (relief, during the water, roads ...).
Besides providing location information and retrieval of large sets of fixed space, the card provides spatial visualization phenomena in many areas and allows the detection of correlations.
It remains one of the best tools for communication of information in many areas.
YOU MIGHT ALSO LIKE: AERIAL PHOTOGRAPHY

A system of map coordinates to assign your spatial data to a location corresponds to the location of objects on the surface of the Earth.
To locate or measure features on a two-dimensional surface, a coordinate system Planar is more appropriate.
locate
- Geographic coordinates system
- Planar coordinate system

A system of map coordinates to assign your spatial data to a location corresponds to the location of objects on the surface of the Earth.
To locate or measure features on a two-dimensional surface, a coordinate system Planar is more appropriate.
Geographic coordinate system
The most commonly used reference system for locating objects on the surface of the Earth is a spherical coordinate system measured in latitude-longitude.
The most commonly used reference system for locating objects on the surface of the Earth is a spherical coordinate system measured in latitude-longitude.
This system can be used to position a point anywhere on the surface of the Globe.
Because of its ability to localize points, the spherical coordinate system is commonly called the Geographic Coordinate System or Global Reference System yet.
Longitudes and latitudes are angles measured from the center of the Earth and anywhere placed on the surface of the earth.
Longitude measure an angle east or west while a measured latitude angle north or south.
Longitudes lines, also called meridians, extend from the North Pole to the South Pole.
The latitude lines also called parallels, encircle the globe parallel rings.
Latitude and longitude are traditionally measured in degrees, minutes and seconds or degrees decimal.
Latitude and longitude are traditionally measured in degrees, minutes and seconds or degrees decimal.
Longitudes values vary from 0 ° to the meridian (Greenwich) to 180 ° when one moves to the east and from 0 to -180 ° when one moves westward.
Latitudes values vary 0 ° (Ecuador) at 90 ° when it moves toward the north, and from 0 ° to -90 ° when moving toward the south.

Coordinate systems planar
Because of the difficulties encountered when taking distances in a coordinate system spherical, the geographical data are projected in a planar coordinate system.
On one planar surface, the positions of the points are identified by x and y coordinates of a grid whose origin is the center of the grid.
Each point is located by a pair of coordinates by the reference to the center of the grid.
The first coordinate marks the horizontal position of the point and the second the vertical position of this point.
These two values are called X and Y coordinates
 A map projection is a method for converting the 3-dimensional surface of the Land in a cartographic 2D flat surface. It may represent the entire surface land or a portion according to our needs.
Map Projection
- The conversion of a geographical positions curved surface to a flat surface

Principle
The principle is quite simple. Early cartographers imagined representing an area the planar projection of the objects placed on the surface of the Earth from a lamp.
The principle is quite simple. Early cartographers imagined representing an area the planar projection of the objects placed on the surface of the Earth from a lamp.
This light source can be placed at the center of the earth, on the opposite side of the globe relative to the planar surface, or a distance from the Earth.
The two-dimensional surface can be a cylinder, a plan or a cone.
Today
Today, all projections use mathematical formulas to convert data of a system of geographic location (latitude-longitude) to a flat surface.
Today, all projections use mathematical formulas to convert data of a system of geographic location (latitude-longitude) to a flat surface.
Although mathematical functions are used to calculate the planar coordinates of the different objects on the surface of the Earth, the term projection is still used to describe the set of rules control existing distortions on different maps.
Difficulties
Projecting a curved surface are two problems difficult to manage:
• Determination of the shape and dimensions of the Earth, it is necessary to model the surface
project.
• the projection on either side of this form in the map: one must choose the projection algorithm.

The concept of distortion
A map projection can bring the geographic point of a curved surface to a flat surface.
Projecting a curved surface are two problems difficult to manage:
• Determination of the shape and dimensions of the Earth, it is necessary to model the surface
project.
• the projection on either side of this form in the map: one must choose the projection algorithm.
Large projection families

The concept of distortion
A map projection can bring the geographic point of a curved surface to a flat surface.
This flattening process causes alterations in shape, the surface, the distance, and direction.
Fortunately, one can choose from several projection systems according to their ability to represent particular portions of the earth's surface and to preserve the distance, the surface or management.
Some projections minimize distortion of a particular property at the expense of others, while other projections generally minimize alterations.
We distinguish different projection, large families:
Conformal projection
These projections preserve the angles on a plane observed on the Earth's surface but change the area ratios. They are the most used. Lambert projections (I, II, III, IV and 93) used for representing the French territory are part of this family.
Conformal projection
These projections preserve the angles on a plane observed on the Earth's surface but change the area ratios. They are the most used. Lambert projections (I, II, III, IV and 93) used for representing the French territory are part of this family.
Equivalent projections
This type of projection maintains the area ratios and change angles. They are much used in statistics and earth sciences.
This type of projection maintains the area ratios and change angles. They are much used in statistics and earth sciences.
These projections include projection Mollweide.
The other families of projections
There are also other projection systems used much less:
There are also other projection systems used much less:
the equidistant projections which preserve distances interrupted projections...

In France, the most used are the projections Lambert projections. The cones projections Lambert is tangent to the ellipsoid along a contact parallel also called parallel origin (from latitude L0).
The top of the cone is located on the line of the poles. The developed cone on a plane gives
Lambert projection.
The origin of the projection corresponds to the intersection between the central meridian forming the Y-axis (Paris meridian) and the parallel origin forming the X-axis coordinates of this origin was modified (for example 600 km by 200 km + X and Y for the Lambert I, II and III) so as to have any negative coordinate onStore projection information

Associate projection files
According to the different data formats, it is possible to store this information in a part of the game of data. In most cases, this information must be stored in a text file associated with the data set.
According to the different data formats, it is possible to store this information in a part of the game of data. In most cases, this information must be stored in a text file associated with the data set.
For shapefiles and coverages, this file is called file projection (.prj file extension) while in the case of image or CAD file, we talk about file georeferencing.
The geodatabase is unique in the sense that it stores itself Information spatial reference in the database and thus eliminates the need to use a separate file.
Viewing projection information

The projection information associated with features in the layer is available from the application ArcCatalog ArcGIS via the Fields tab of the Layer Properties dialog box.
When the user selects the Shape field, all the spatial properties of the layer appears.
The type of entities stored in the layer is available (although not modifiable) and the reference space wherein data is stored.
The type of entities stored in the layer is available (although not modifiable) and the reference space wherein data is stored.
To view all the parameters associated with this coordinate system, just click on the gray button to the right of the name of the system reference. The buttons in the lower part of the dialog box to a user experienced possibly modify the parameters
Inform projection information

Inform projection information
If projection information has not been defined in advance by the user, ArcCatalog shows Unknow spatial reference as the value (unknown). By clicking on the gray button to the right of this value ArcCatalog opens a dialog box named spatial reference properties with all the tools of the definition of the projection system.
By clicking the selection button, ArcCatalog offers the user to select from himself all predefined coordinate systems, one that corresponds to the source of these data.
The Apply button allows ArcCatalog to automatically create the projection file or georeferencing corresponding to the data. When this file is created, the projection information is stored with the data source and any application of ArcGIS can exploit.
The Apply button allows ArcCatalog to automatically create the projection file or georeferencing corresponding to the data. When this file is created, the projection information is stored with the data source and any application of ArcGIS can exploit.
Tutorial ArcGis: Working with Tables Part 2
TUTORIAL ARC GIS GETTING TO KNOW ARCGIS DESKTOP
Chapter 5: Working with tables continue
 |
| Tutorial ArcGIS: Working with Tables Part 2 |
The summary tables

You have several options to summarize the data in a table, whether by summarizing all lines thereof or only selected lines from the values of the selected field.
- First, select the field that should use ArcGIS to calculate the statistics.
- Then doing a Right-click on this field, and choose Summarize.
- Then, select one or more summaries statistics included in the output table.
- Finally, specify the output table.
For numeric fields, you can choose from the following statistics:
First/Latest

Results of a summary table
When you make a summary of data from a table, ArcGIS creates a dBASE file a line (a record) for each unique value of the selected field. Each of these lines fields includes Count (Workforce) indicating how many records have the original table this value.
- Minimum
- Maximum
- Average
- Sum
- Standard deviation
- Variance
First/Latest
Results of a summary table

When you make a summary of data from a table, ArcGIS creates a dBASE file a line (a record) for each unique value of the selected field. Each of these lines fields includes Count (Workforce) indicating how many records have the original table this value.
Each line also displays the summary statistics of the results for all required
Another field of the original table.
The summary table of the example above includes three fields.
The field contains NOM_EXPLOI one row per unique value; Count_NOM_EXPLOI the field displays the number of records having this value (number of Sauvignon in fields operated by the winemaker); Finally, the field Sum_SURF_PLANT indicates the total area exploited by vineyard operator.
The output file is in dBASE format. It can be added to the ArcMap table of contents.
Note
The new summary table may be attached or linked to the attribute table of the layer.
You can then query or represent the layer from the values of the summary table.
YOU MIGHT ALSO LIKE: The Quantum GIS Training Manual
 The diagrams used to help interpret large volumes to attribute data type quantitative (digital) by allowing a graphic representation of the values.
YOU MIGHT ALSO LIKE: The Quantum GIS Training Manual
Diagrams

Different types of charts
It is possible in ArcMap to represent your data and analyze your results using many styles diagrams in two or three dimensions.
ArcGIS Server uses the graphics Pinnacle Publishing INC. It provides a large number of different patterns so as to best represent your data.
Digital data representation
The values used in the generated graphics ArcGIS are derived from data contained in the attribute tables. Depending on the information you want to use in your chart, you can choose the most appropriate chart type representation of your data.
Visual control of your charts when creating
It is possible to control the representation of your diagrams when creating by relying on the chart wizard. Each element can be modified: the title, the axes, color each element, the police...
The diagrams in a map
When a chart is created, you can display it directly into a map in Layout mode.
When placed in this type of document, it becomes a graphic element that you can resize and place it where you like.
When placed in this type of document, it becomes a graphic element that you can resize and place it where you like.
However, it loses its dynamic nature, ie the change of one or more values in your source data will not be reflected in the diagram.
Creating charts

They allow you to view information easily discernible in the document Mapping.
They can even submit additional information regarding entities or present otherwise the mapped information.
The Chart Wizard
The wizard available in ArcMap facilitate the implementation diagrams.
This wizard allows, through a series of steps to create, manage, or load an existing chart.
 A report can present information associated with map features more than attractive than a table.
From a table, you can choose which fields to display in your report and how to display them.
Relationships
- Organize and display data tabular -Consolidates data
- Registration and exports
- Crystal Reports

From a table, you can choose which fields to display in your report and how to display them.
When the report is created, it is possible to integrate it with your card or save it.
Organize and view data
Show the data in a report enables you to organize data. It is possible to sort records based on the values contained in one or more fields of the table.
For example, it can sort the departments based on population or simply sort in alphabetical order.
This way you can quickly see what the French department the highest population.
It is also possible to calculate summary statistics on the values of a or more fields (sum, average, standard deviation ....)
Data Group
Reports can be divided into different parts, each corresponding to a particular aspect of the report.
You control the creation of the report by manipulating the components of the part and defining properties such as color or size.
For example, the top part of the report contains usually the title and subtitle.
However, you can decide not to show any part of the report if you do not have the need.
Save and export
You can save the report to disk and use it in another program or in another card.
This creates a static copy of the report is, therefore, more dynamic. You can export your report in various formats such as PDF (Portable Document Format) RTF (Rich Text Format) or plain text format (TXT).
It is also possible to save your report as a report template.
Crystal Report
Provided with ArcGIS, Crystal Reports is a powerful software through a wizard to create advanced reports containing all the elements necessary for the proper interpretation of your data.
The report creation wizard
- Allows you to quickly create and organize reports

Crystal Report
- Wizard of report
- Many sources of data
- Creating charts
- Many formats Export reports(Lotus, Excel, HTML ...)


The Crystal Report software
Crystal Report is a software package of the company Seagate Software to create reports (also called reports) from various data sources (ArcView tables, dBase files, Access files, sources ODBC / SQL database, Oracle databases, ...).
Crystal Reports provides a set of authoring tools and manipulations of states with an interface graphic composed of menus, buttons, tools, and dialog boxes for setting each element of the state (data tables, charts, labels, images, ...).
Crystal Report comes with ArcMap but its installation is optional. If you do not have installed Crystal Report software, ArcMap will not give you access to the control via reports
Tutorial ArcGis: Working with Tables Part1
TUTORIAL ARC GIS GETTING TO KNOW ARCGIS DESKTOP
Chapter 5: Working with tables in ArcGIS
 |
| Tutorial ArcGIS: Working with Tables Part1 |
Tables

In ArcGIS, the information in a table is often associated with the referenced data.
However, this information can be independent of the data stored in an information layer.
Descriptive Information
To access the attribute table in ArcMap, just click with the right mouse button on the name of the layer in the table of contents of the map document and select the Open command Attribute Table.
In ArcCatalog, just select the source file data and to view content in the Preview tab.
Each layer has an associated table
Each layer shown in the table of contents of the ArcMap document has a single table containing all the attributes associated with the features in the layer.
Each entity is associated with one record
An attribute table consists of fields (columns) and records (or rows) that contain the attributes associated with an entity of the data set.YOU MIGHT ALSO LIKE:
Link entities and attributes

Although the name of the identifier may be different depending on the data format, it is important to understand the relationship of one to one uniting the entity, its identifier, and record in the attribute table.
Understanding the structure of a table
- Table Database Properties:
- Different types of fields:

Each table is built on a single model: an assembly of rows and columns.
At the intersection, a row and a column is a value characterizing an entity.
The basic properties of a table
Some tables have a number of defined fields. For example, a polygon coverage has four default fields: area, perimeter, cover, and cover-id #. Other tables contain only user-defined fields. This is the case of the table shown in the Example below above.
Some tables have a number of defined fields. For example, a polygon coverage has four default fields: area, perimeter, cover, and cover-id #. Other tables contain only user-defined fields. This is the case of the table shown in the Example below above.
ArcGIS automatically adds a field named FID when displaying values.
This field does not physically exist in the data source file but can be used like any other column to query.
The number of fields stored in a table is not limited, however, each field name must be unique.
Against two fields can store the same data in two different forms.
Generally, the most commonly used values are numbers, strings, or dates.
Some tabular formats ArcCatalog and/or ArcMap can manage fields short integer, long integer, real simple, double real, text, date, identifying, and blob fields.
Different types of fields

short integers (2 bytes /octets) de –32767 à 32767 (de -215 à 215 )
long integers (4 bytes /octets) de –2 147 483 648 à 2 147 483 647 (de -231 à 2 31)
Simple real or floating (4 bytes /octets) de 1,401298*1045 à 3,402823*1038
real double (8 bytes /octets) until 1.79769313486232*10
Text (10 bytes /octets + nb characters) Jean Bono (19 bytes/octets)
Date (8 bytes /octets) 10/05/2001/login/Blob
Integer (we keep a bit for the sign, for the other 15 significant digits)
mini -32768 =>1 1111111 11111111 1x(-1) x ( 1x215 + 1x214+1x213+… .+1x20)
maxi 32768 => 0 1111111 11111111 0x(-1) x ( 1x215 + 1x214+1x213+… .+1x20)
1 bytes/ octet 2 bytes/ octet
Other types of controls may be available depending on the software which has generated the data (Access, Oracle ...).
Different tabular formats
- Each ArcGIS spatial format has its own native format attribute data
-DBase files (file types)
-Table of geodatabases (RDBMS)
-External Tables via ODBC / OLE DB
- We can associate to a source of spatial data in any format of attribute data

- The ArcGIS tools used to perform format conversions
Each spatial data format has its own tabular data format
ArcGIS can use different sizes of fields in storage and information management allottees.Each spatial data format has its own tabular data format.
The use blankets INFO tables to store attribute information; shapefiles ArcView store attribute data in files in dBase format; geodatabases store all information in RDBMS tables (Access or Oracle for example).
Certain spatial data formats can be associated with various tabular formats.
Some formats, such as covers, can be associated with independent tables.ArcGIS has formats conversion tools
To facilitate information sharing, ArcGIS has tools for converting the fields of a type to another.YOU MIGHT ALSO LIKE: WHAT IS GEOMATICS? / GEOMATICS

From ArcMap or ArcCatalog, it is possible to perform sorting, research, selection or gel values. ArcCatalog lets you create new tables, new fields or delete existing columns.
ArcMap lets you change the values in a table using the calculator field values.
 After creating a selection, it is possible to calculate simple statistics on a values field. These statistics to quickly visualize and evaluate a selection.
When you select the field containing the values of all following statistics are displayed in the window and you may see the histogram distribution.
• Minimum
• Maximum
• Sum
• Average
• Standard deviation
If no line is selected in the table, the statistics that appear concerned all lines chosen field.
manipulating table

ArcMap lets you change the values in a table using the calculator field values.
histograms distribution

Statistics
Select the command Statistics from the dropdown menu option to display the window Statistics in which you can view statistics calculated values on any numeric field of the table.When you select the field containing the values of all following statistics are displayed in the window and you may see the histogram distribution.
The types of statistics
• Total workforce)• Minimum
• Maximum
• Sum
• Average
• Standard deviation
If no line is selected in the table, the statistics that appear concerned all lines chosen field.
Tutorial ArcGis: Update Data
TUTORIAL ARC GIS GETTING TO KNOW ARCGIS DESKTOP
Chapter 4: Update data
 |
| Tutorial ArcGIS: Update Data |
Editing in ArcMap
- Editable data; Shapefile (+ ArcInfo ArcEditor ArcView +)/Personal Geodatabase (+ArcInfo ArcEditor ArcView +)/ArcSDE Geodatabase (+ ArcEditor ArcInfo)/Coverage (+ ArcEditor ArcInfo)
- Simultaneous Edition of several layers (topology)
- Editing a feature class source
- Only one layer at a time
- A single block of data at a time
- Viewing the source table of contents

Editing in ArcMap
Update feature geometry is a common task when working with GIS.
It is sometimes necessary to correct erroneous data to best represent the shape, size, and position of real-world objects or add information to a data layer missing.
ArcMap allows, in addition to cartographic design functions and data analysis, to create, modify or delete entities contained in an information layer. Functions Detailed in this section of the course are the simple editing functions.
Advanced features are addressed in the current ArcGIS - Level II.
If ArcMap can read natively many spatial data formats, it can not however set update the geodatabases, coverages, or shapefiles.
If a card contains several blocks of data, updates can be made only on the layers managed in the active data frame.
If a card contains several blocks of data, updates can be made only on the layers managed in the active data frame.
Updates can be done only on layer information at a time. However, if the topology relations between entities of several diapers, a change to the features in a layer affect the entities of the other layers linked.
To view the source of your data that will be affected by your changes, you can use the Source tab of the Table of Contents of ArcMap document.

Publisher toolbar

Editor toolbar
The various functions of updating the data in ArcMap are accessible from a toolbar tool: the Editor toolbar. This toolbar contains many tools to facilitate the update data.
Before carrying out an update of the spatial data or attribute of a layer, it is necessary to add to the ArcMap interface the toolbar editor to start, stop or control the session editing.
This toolbar contains a large number of tools to facilitate the updating of data.
It is accessible from the View menu, via the Toolbar command.
Publishing general principles

Editing session
All changes are made in an editing session.
The steps in the editing process data in ArcMap is to start an editing session, make changes, leave the editing session and eventually save changes.
All changes during an editing session will be immediately visible in the map document.
Save ArcMap document does not necessarily save changes to your data.
Start an editing session
When you start an editing session, ArcMap displays the dialog box Log in the update.
Select the folder or geodatabase containing data you want to make these changes.
You can not change in one editing session that the layers contained in the same block of data.
If the same data block contains layers from multiple geodatabases ArcMap asks you to choose how you want to edit geodatabase.
In any case, you can AMEND multiple geodatabases in the same session.
YOU MIGHT ALSO LIKE: GEOGRAPHIC INFORMATION / GIS TRAINING
Select entities to change

Set Selectable Layers
It may be necessary to limit the layers in which you do not want to select entities.For example, if you have a lawyer representing the cities, most of these cities being located along the river, it may be necessary not to make the layer containing rivers selectable so as to consider only the cities.
The dialog box Set Selectable layers are accessible through the Select menu, control Set Selectable layers. In this dialog box, select the layers containing entities you want to select.
Selecting entities
The tool is the Update feature selection tool. With this tool, you can choose to select a single entity located in a selectable layer, pointing in the view or more entities in holding down the Shift key on your keyboard and pointing each object you want to add to the selection set.creating features

Updates to The operations are performed from a presentation layer in the table of contents ArcMap document. This layer may already contain entities or be empty and have been created in ArcCatalog.
Creating or updating a layer involves several steps:
1- The Open command an update session available in the dropdown menu Editor toolbar of the same name gives access to various editing tools.2- In an editing session, it is necessary to select the layer you want to update. By default, ArcMap selects the first layer in this block editable data.
The selection of the layer to be updated is in the Target box on the Editor toolbar.
3- Then select the drawing tool you want to use to create a new entity.
4 Draw the entity or entities.
5- Once the changes are complete, go to the Exit menu setting session update the Editor bar to validate your updates.
4 Draw the entity or entities.
5- Once the changes are complete, go to the Exit menu setting session update the Editor bar to validate your updates.
He then asked if you want or not save your work.

Lors d'opérations de mise à jour dans ArcMap, vous ne modifiez jamais une entité mais toujours une copie virtuelle nommée Construction.
Working with constructions

Lors d'opérations de mise à jour dans ArcMap, vous ne modifiez jamais une entité mais toujours une copie virtuelle nommée Construction.
During update operations in ArcMap, you never change but still an entity a copy Virtual Construction named.
Building
In ArcMap, feature geometry is represented by a construction.
A construction is consists of the vertex (vertices) and segments (reliant string vertex).
When making Operations Updates features in ArcMap, you work only on these constructions, never on the original entities.
ArcMap allows you to change existing entities or creating new in an existing feature class. To create new feature classes, it is necessary using ArcCatalog.
When you want to create new features, you must first create an erection.
During the modification of entities, you change the construction.
When recording, the entity is updated with the changes, you made on your building.
You can only create the construction of line or polygon features, points with neither vertex or segment.
The Construction menu
The majority of tasks in ArcMap is accessed through two shortcut menus.
The context menu Construction appears when you click the right mouse button while the pointer is located on a vertex or a segment.
The other context menu, build tool, is accessible when you create a building with a construction tool.
You can edit vertex by selecting it with your mouse and moving it to its new position (either by specifying its new x and y coordinates or by specifying a delta x, y indicating the top of the moving distance in x and y with respect to its initial position).
You can edit vertex by selecting it with your mouse and moving it to its new position (either by specifying its new x and y coordinates or by specifying a delta x, y indicating the top of the moving distance in x and y with respect to its initial position).
It is also possible to change the orientation of a building using the reverse order.
The added new segments from the last vertex usually, appear in red.
The order Reverse so that the first vertex construction becomes the last vertex of the construction.
To change the length of a segment, it is possible to use the Truncate command. The length of the segment will be changed depending on the value of the extension you specify.
When your design is finished, select the Finish Sketch.
simple editing functions

Some features of the standard interface can be used when updating the operations of data in ArcMap.
Tools Cut, copy, paste, delete are accessible directly from the toolbar and the Undo and Redo commands.
You can cut or copy features in a layer and paste them into any other information layer.
Moving entities
Where entities are selected, it is possible to move manually by selecting them with the Edit tool and dragging in the geographic viewing area.
The order Move the Menu Editor allows you to perform these entities translating a distance defined in X and Y.
Simple editing functions


The splitting tool
ArcMap has a tool to divide a single click a selected entity into several entities.The rotation tool
The Rotate tool allows you to rotate an entity around its selection handle.
When you click in one entity with the Rotate tool, the default selection handle appears at the center of the entity.
By selecting this handle with the same tool, ArcMap allows you to move it to the entity and therefore to change the axis of rotation of the object.
Once the selection handle in the right place, you can rotate the entity manually.
In pressing key A it is possible to define a precise angle of rotation of your object.
In that case, the entity pivots in the direction of clockwise in the case of a positive angle in the reverse direction the angle is negative.
Edit Attributes

Select the entities you want to change the attributes and open the Attributes window by clicking the button in the Edit toolbar.
The Attributes window
The Attributes window allows you to view the attributes of selected entities.
The left side of the box dialog lists the selected entities.
Entities are referenced by a number identifying and appear grouped by layer.
The right window has two lists of the values dialog box: the first column shows the field names in the table while the left column shows the value for each field of the attribute.
Select Features
Each layer containing the selected entities is listed on the left side of this window.
You go to each entity individually by clicking on the + sign before the name of the layer.
In the example above, entities belonging to three different layers were selected.
Update the attributes of an entity
You can update the attributes of a single entity by clicking on the value to be changed and typing the new value.Update the attributes of several entities
If you want to change an attribute of multiple selected entities, just click on the name of the layer containing the entities, you want to change the values.
In the list on the right of the dialog box, type the value you want to change.
Thus, in the example above, the different selected municipalities will be assigned the value "Small crown" in the field named "CODE_COURO".
Copy, cut, and paste
You can use the functions to copy, cut, and paste the field values.
Thus, the value copied will be assigned as an attribute to the selected entity or entities selected.
Use the Field Calculator
- Access the field calculator
- Create a simple expression or expressions Logical

In ArcMap, you can change the values of a field using expressions calculations simple or logical expressions in the calculator field values.
The Field Calculator can work on selected entities or all entities if no selection exists.
The field values calculator
To access the calculator field values, it is necessary to be in an edit session and to open the attribute table by clicking the right mouse button on the layer name in the Table of Contents.
In the dropdown menu, select Open Attribute Table. When it is open, click with the right mouse button on the name of the field you want to calculate, choose from the menu that appears to Calculate command values.
Build Expression
Creating expressions in the Calculator field values can be achieved by combining fields, functions, and operators presented in two lists: the first list displays all field names contained in the table, the second list of all available functions.
In Double-clicking on the values contained in these two lists, it is possible to create calculations but also simple to create complex expressions calculation taking into account several fields table.
If a selection exists in the table, only the selected cells are calculated.
If no selection is the calculator field values apply the expression to all the cells of the table.
Once you double-click a field or operator in the calculator field values, the field name or function appears in the expression window.
Note that it is possible to save an expression or load an existing expression using The Save ... buttons; and Charger ...
Note that it is possible to save an expression or load an existing expression using The Save ... buttons; and Charger ...
Tutorial ArcGIS: Working with Tables Part 1
Subscribe to:
Posts (Atom)


