
Showing posts with label GIS TRAINING. Show all posts
Showing posts with label GIS TRAINING. Show all posts
GIS: Methods of analysis / GIS TRAINING
 |
| GIS: Methods of analysis / GIS TRAINING |
CHAPTER4: Methods of analysis in a GIS
Queries and interrogations
- Query, exploration, statistics
Metric measurements and calculations
- Metric properties of objects: length or perimeter, surface, etc.
- Relationships between objects: distance, orientation
Data transformation
- Creating new descriptive attributes
- Based on arithmetic, logical, geometric rules
Information synthesis
- Scale transfers
- Geostatistics and interpolation
- Changes in spatial location
Optimization techniques
- Optimal locations
- Shorter paths, operational research
Classification methods
Descriptive classification (grouping on a descriptive criterion)
- Maintain the form of the distribution
- Maintain dispersion: maximize the interclass variance
- To reveal the irregularities of the series
Discretization methods (examples)
- Classes of the same amplitude
- Equal enrolment classes (quantiles)
- Use of mean and standard deviation (normal distributions)
- Arithmetic or geometric progression
- Natural Threshold Method
Examples of methods using localization
- Selection of objects on a distance or membership criterion: the creation of buffer zones (or buffer, or mask)
- Selection of objects based on orientation or direction criteria
- Connecting objects on a criterion of distance or belonging: crossings, hierarchy, aggregation, belonging
- Classification by proximity: grouping on a geometric or topological criterion (aggregates)
- Proximity and neighborhood operations: geostatistics and interpolation
Changes in the type of geometric object
- From point to point objects: point to the mesh by interpolation, point to the zone by influence (Voronoi) or aggregation, point to the line by creating curves of aggregation
- From the objects line to line: line to the zone by expansion or aggregation (weighted by an interaction distance), the line to point (calculation of centroids), the line to mesh by interpolation
- From the zone objects: zone to point (centroid), zone to the line (skeletonization), zone to mesh (rasterization)
- From mesh objects: mesh to the area (vectorization), mesh to mesh (rasterization and resampling methods)
GIS and remote sensing
Geo-referencing and mosaics
- Geometric transformations and photogrammetry
- Adjustment and adjustment of values
Which object: point or area?
- From pixel to geographical object: processing by zone or by pixel?
- The use of semi-joining and aggregation operations
Conventional methods in remote sensing
- Different types of satellites, different methods: channels are attributes, indices are methods
- Directed and non-directed classifications
- Vegetation, building, texture, structure, etc. indices Morphology math.
Urban remote sensing
- Aerial photography and orthophoto plans
GIS and interpolation: digital field models
DTM by interpolation
- From points or lines by interpolation
- Many methods to move from the point to the area: nearest neighbors, inverse distance, Splines, kriging, etc. (deterministic methods vs. probabilistic methods).
DTMs and their methods
- Slope, orientation, drains, flows, volumes, visibility, watersheds, etc. Hydrology models.
Representation by illumination, representation in perspective
Distance models, influence models, influence areas


GIS and optimization
Networks and graphs
- operational research applications: optimal path
- distances along with a network, accessibility problems

Cartography
Cartographic language and graphic semiology
The cartographic language
- The components of cartographic language
- The elementary graphic signs (point, line, task), the cartographic figurative (built from the elementary signs), the graphic layout (punctual, linear, zonal), the visual variables (shape, size, color, value, orientation, texture-structure, grain).
GIS and mapping
- Automatic mapping from a query
- Choice of a cartographic projection
- Association descriptive attribute - graphics attribute (figurative, layout, visual variables)
- Automatic label positioning
- Filtering and generalizations
Dressing a map
- Graphic scale
- North Arrow
- Title
- Corps Map
- Legend
- etc...

GIS and the Internet
Software: different organizations
- Application and data on a single computer at the customer's premises
- The client application and data server over the local area network
- Data server and application server over the local area network
- Data server and Internet application server, query using an Internet browser
Remote interrogation, dedicated applications
-An "application" organization-A Client/Server organization
-A server managing the database, responding to requests
-On the customer side, several solutions, for dedicated applications:
- CGI
- Applet or ActiveX
- ASP .Net
- JSPX
- SVG
Available data of uncontrolled quality
- Data and metadata: an essential requirement
- Quality that is often difficult to assess, data to handle with care, unknown contexts
- Extraordinary data servers (USGS, NASA, Google...), but whose free availability is not guaranteed in the long term
- Multiple questions on data/information/knowledge ownership
GIS: organization
Project definition and feasibility study
- Drafting of specifications describing the objectives and needs of the application.
- Evaluation of the necessary data and acquisition flows.
- Assessment of the system specifications and objectives in relation to existing systems on the market, to assess the feasibility of the operation and the costs involved.
- Final evaluation of the various possible choices in terms of benefits and costs.
Logical organization and functional implementation
- General implementation and administrative body (human and financial needs, training and user assistance plans, management of future system evolution based on operating results)
- Data acquisition body to manage the various information flows (regular or application-specific flows). This body is responsible for evaluating and describing information sources, access procedures, and acquisition procedures.
- Data entry and integration body: structuring, homogenization, validation, coding, coding, entry, control, correction, and integration of data according to the techniques required by the information system.
- Data analysis and exploitation body ensuring that user requests and application needs are met according to the specifications.
GIS: Datum and projections / GIS TRAINING
 |
| GIS: Datum and projections / GIS TRAINING |
CHAPTER3: Datum and projections
The measurement and representation of the location
- The objective of linking to the location requires a common reference frame and known details for the location attribute.
- Objects must be georeferenced in the same system.


Datum: the shape and position of the Earth
A reference system, combining:
- The definition of a reference form to describe the position of a point by spherical coordinates (longitude, latitude, altitude). This shape is an ellipsoid of revolution.
- The position of this ellipsoid in the universe (center and inclination)
Many systems have been defined, independently of each other, by conditions of tangency of the ellipsoid to the Earth's surface at a point
All the coordinates of objects in the same database must be expressed in the same system in order to be comparable
YOU MIGHT ALSO LIKE: General Principles Of Gis/Gis: Definitions And Main Functions
-ArcInfo
-Geodatabase (ArcGIS)
-Spatialware (MapInfo)
YOU MIGHT ALSO LIKE: What is ArcGIS?: ArcView | ArcEditor | ArcInfo
YOU MIGHT ALSO LIKE: General Principles Of Gis/Gis: Definitions And Main Functions
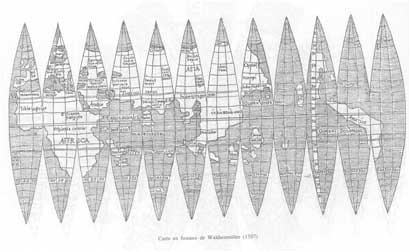
Projection: represent an ellipsoid on a plane
- A cartographic projection is a mathematical operation allowing to represent a portion of the ellipsoid on a plane, by estimating the deformations induced by this operation on curvilinear distances, angles, directions, curvilinear surfaces...

Databases
From the object to the collection of objects: databases
- The purpose of the schematization of reality here is to describe not a single object, but a set of objects. It is therefore even more reductive since the context is that of a collection. Attributes must, therefore, be common to all objects in the collection.
- A database is an association between a schematization of reality and the objects describing reality according to this schema.
- The need for computer management is obvious, to manage all objects in relation to descriptors (attributes), to manage the links between objects and to connect objects to each other. This is managed by a database management system (DBMS).
Database management systems: objectives
- Physical and logical independence between data and application programs
- Object persistence
- Centralized data administration
- Optimal management of computer memory and efficient data access
- Sharing data between users and managing competing accesses
- Reliability, integrity, and consistency of data
- Data Security
- Interactive queries, declarative data consultation, access to non-computer specialists
The relational model
-A simple description model
- Objects are described only by simple type attributes (for example, no attribute in R2 or R3, no recursive definition, no methods)
- The set of objects described by the same attributes is called a relationship. Objects are called tuples
- All the objects in a relationship can be represented by a table (line=tuple, column = attribute)
-The tuples are manipulated using relational algebra operators, a formalism that allows the content of the database to be queried:
- union
- Cartesian product
- projection
- selection
- joint
The extension of the relational model
- Simple and powerful, the relational model only handles data related to the natural order (in the selection and join criteria). It does not allow to properly process data of dimension 2 or more, such as location.
- To treat the location of geographical objects with a relational system, it is, therefore, necessary to extend the relational model and algebra for R2 or R3 data. The operations related to this type of data are based on the distance between objects, on ensemblist notions (union, intersection, belonging), on topological notions (adjacency, connectedness), and no longer on a simple order relationship.
Implementation in GIS software
-Management based on descriptive joins
- Geometry and topology are stored in separate files
- Descriptive information is managed by a traditional DBMS
- A unique identifier per object makes the link between geometry and description
- Examples:
-ArcInfo
-Management based on an extension of the relationship to localization
- Geometry and description are managed together
- Two-dimensional indexing is possible
- A two-dimensional BD motor (SDE) is used
- Examples:
-Geodatabase (ArcGIS)
-Spatialware (MapInfo)
YOU MIGHT ALSO LIKE: What is ArcGIS?: ArcView | ArcEditor | ArcInfo
Limitations of the extended model
- Hierarchy, belonging, classification by neighborhood... need to introduce methods and types of complex objects (zones, lines, points), hence the de facto extension of the relational model towards object-oriented concepts
- Query or consultation operations take the form of real methods and call into question the principle of DBMS: GIS becomes a real application program, and cannot be limited to data management.
A look back at the spatial integrity constraints
- Some geometric or topological constraints will always have to be checked (for example, an area must always be closed), as they depend on the logic model or internal description model
- Others depend on the semantic definition of the collection (a road network must always be connected, but a telephone network may not be)


-Geometric constraints on arcs
- Simplicity (overlapping of an arc on itself)
- Extra-simplicity (intersection or duplication of arcs)
- Inclusion
- Closing up
- Connectivity

-Topological constraints of type (area, line, point)
- Closing of areas
- Belonging of the centroid to its zone
- Connection of zones or networks
-Relationship constraints
- Unique key constraint
- The constraint of belonging to a domain
- Neighborhood constraint
- Metric constraints
-Joint constraints
- Geometric joining constraints: geometric belonging, inclusion (junction of boundaries and hierarchy of relationships), sharing (sharing of arcs between collections),
- Descriptive join constraints
geographic information / GIS TRAINING
 |
| geographic information / GIS TRAINING |
CHAPTER2: GEOGRAPHIC INFORMATION
Data, information, knowledge
Data:
numbers, text, symbols, usually neutral and independent of context (raw measurements without interpretation)Information:
differentiated data as dedicated to a subject or subjected to some degree of interpretation
Knowledge:
information interpreted in relation to a particular context, experience, or for a particular purpose
Data or information?
- How to understand and represent reality to deal with a computer?
- universal vision or contextual vision?
- How to define criteria description of reality without a specific problem, to begin with?
- Precision, scale, and description, modeling reality: the approach of the geographer.
A data model is a set of rules to represent objects and behaviors of the real world in the logical framework of a computer.
There are four levels of abstraction of reality:
- The real world (no abstraction)
- The conceptual model (conceptual modeling of reality)
- The logic model (organization model of computer-related)
- The physical model (an internal organization to the application)
The geographic data
- Recording measurements were taken at a certain place at a certain time in the real world
- Combines location, time, and descriptive attributes
- Difficult to handle in conventional systems data management, which are not equipped to higher dimensional data 1
The spatial object
- An object in information theory is an encapsulated set of attributes and methods for describing knowledge and behavior to the contextual view of reality.
- Spatial Object has three major components: location, description, behavior


The different types of attributes of a geographical object:
Information descriptive :
- Simple classical data (finite set, N, Z, Z, R, etc.) and methods related to the natural order. Modality, value.
Location information :
- Location data: in two or three dimensions (R² or R3), points, or set of points (elements or sets).
- The location attribute: new definition space, new methods, new measurements, new precision.
Real-World Modeling: From Reality to Geography
- Description and precision of location, methods, attributes, for the definition of a geographical object.
- Links between descriptive attributes and precision of the location attribute for the definition of the geographical object. Example: mapping generalization?
- The geographical object: the relationship between semantic definition (descriptive attributes) and precision of the description of the geometry of the location.
From geography to geometry: mapping the location
- The classic cartographic mapping model in zones, lines, points (in a continuous, 2D or 3D space). The map and its history.
- The pixel: an area or a point?
Limitations of the mapping model
The limits of geometry and cartographic model:
- It is assumed that classical geometry can be used to describe the location of geographical objects. We, therefore, introduce discontinuities into reality by using zone, line, point schematization to define geographical objects. Accuracy or uncertainty are not addressed by these description models. Space is not treated continuously, the geographical definition of objects is discontinuous and greatly simplifies reality.
- Is the geometric description in zone, line, point sufficient to describe geographical objects in a satisfactory way?
Cartographic model and computing power
The contributions of information technology:
- From geographical description to computer description: should computer science take over the geometry of objects or question the overly simplistic schematization of the cartographic model? Will it make it possible to improve space modeling, whereas for the moment it only uses existing schemas (the cartographic model)?
- Aren't the treatments applied to geographical objects in GIS too sophisticated in relation to the validity of the schematization of reality?
From geometry to computer science: a logic model
Raster representation
- The localization of objects is totally simplified (all objects have the same size and shape). Only one object geometry (the mesh) is defined to which all descriptive attributes are attached.

- raster data fills the entire space
- The accuracy is fixed once and for all, and generally degrades the accuracy of the cartographic model from which the information is derived
- The implementation of computer algorithms for analysis operations is easy, but the difficulty of spatial analysis remains complete
- A distinction must be made between "raster representation" and "raster-type" information, such as satellite images or scanned photographs: the accuracy depends on the sensor and does not degrade the original data.

Vector representation
- Zones and contours, networks and lines, points. The geometric definition of the objects in the cartographic model is retained, but a mathematical description (in R2 or R3) is changed to a simple computer description in a discrete set (with a finite number of parameters):
- Representation of an arc by a finite set of points. Representation of an area by a set of arcs. Graphs and networks.

- The objects of the conceptual model are not modified, the geometric accuracy is maintained, the graphical-descriptive relationship is not disrupted
- Storage space is low
- The structure allows two-dimensional indexing


Pixel representation
- Satellite images or scanned aerial photographs are different from a raster representation: the grid location comes directly from the sensor. Information is the value of a cell, called a pixel. It is not a logic model, but a conceptual model of reality description (model defined by the sensor manufacturer, who chooses the resolution, wavelengths).

- The main purpose of remote sensing is to move from pixels (and the descriptive values it contains radiometry or grayscale) to the location of objects defined by their descriptive content (land use, vegetation type, etc.) by grouping pixels.
- Another approach is to treat the pixel as an area object. Everything depends on the size of the pixel in relation to the definition of the geographical object being studied (can the pixel be assimilated to a point in the mathematical space or should it be considered as an area?

GIS : geographic information system / GIS TRAINING
General principles of GIS
CHAPTER1: GEOGRAPHIC INFORMATION SYSTEM
 |
GIS: geographic information system / GIS TRAINING
GIS: multiple definitions
- a particular type of database used to manage objects associating descriptive data to the localized physical entity
- tool storage, management, and exploitation of spatial information
- a computer tool enabling mapping of production from a spatial database
- an approach that integrates a technology package (software), informative (geographical data) and a precise methodology
GIS: main functionalities
- Digital capture and storage of plans and maps
- Diagraming, organization, structuring, archiving of geographical information
- Management of collections of localized and non-localized objects
- Administrative management (e.g. land registry) and data sharing between users
- Metric calculations (distances, areas, perimeters, volumes), positioning and geographical
- projectionsTechnical and engineering calculations (visibility, optimal routes, etc.)

- Spatial analysis, statistics, and classifications, geostatistics &&&&&&
- Aerial and space remote sensing
- Geo-referencing, image management, and processing
- Simulation and modeling
- Digital terrain models, geomorphology, hydrology, hydrology, flow
- Cartographic editing, automatic mapping, statistical mapping Internet and remote interrogation
 Example: Use remote sensing to create or update geographic data

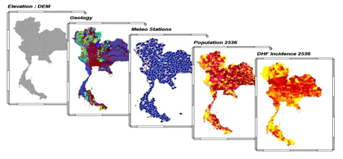
- One main advantage: by bringing together in the same set different collections of localized objects, a GIS allows objects from different collections but located "in the same place" to be linked. Generally speaking, a GIS uses localization to connect objects
- Facilitates answers to questions such as "why here and not elsewhere"
GIS: historical
The years 1960-1970: the beginnings
- military applications, natural resource studies, urban information systems
- Systems development in raster mode
- Development of computational geometry
- Computer ramping
- industrial design systems for vector
- Development of automatic mapping systems
- Development of remote sensing
1980: consolidation
- Large databases and development of the theory of databases (relational model)
- Development of graphical interaction and workstations (SUN, APOLLO)
- GIS Development (raster-vector, statistics, mapping, etc.)
1990: broadcasting
- Industrialization and distribution of GIS technology
- Microcomputers replace stations
- Development of graphics hardware cheap
- Integration of data from different sources (aerial and satellite remote sensing, GPS)
- Applications in all areas with ties to the location
The 2000s
- knowledge representation and mapping of the real world
- 3D GIS, time management
- graphic animations, simulations, and modeling
- GIS and Internet: consultation
- GIS and Internet: broadcast data, metadata, freeware
Today: software and hardware
- Lightweight software on personal computers: statistical mapping, raster systems, elementary automatic mapping
- More sophisticated systems dedicated to mapping publishing (Intergraph, MicroStation, Autocad...)
- Generalist GIS (MapInfo, ArcGIS, Arc/Info, SavGIS, Illwis,...)
- GIS specialized in a field (geology, hydrology, oceanography, remote sensing...)

Personal computers and screen capture have replaced workstations and tables to be digitized
Subscribe to:
Posts (Atom)


